Differential Gene Expression Analysis of Idiopathic Pulmonary Fibrosis
Finding differentially expressed genes in IPF versus control lung samples from GSE150910.
IPF is a disease that affect the lungs making them scarred and its cause is unknown. It usually affect people 70-75 years old and it makes breating hard.

In this project, we’re going to analyze the datset released by Furusawa et.al 2020 containing gene expression counts with Chronic hypersensitivity pneumonitis (CHP), idiopathic pulmonary fibrosis (IPF) and control samples. We will be doing DEA(finding out how much mRNA of gene x is expressed in sample y) on IPF vs control to identify the genes which are more likely to be found in these patients.
- We will first downlond the dataset and preprocess by removing the CHP samples and organizing our data.
- The sequence depth of each samples(the total number of all genes within a sample) can vary from sample to sample which will affect our analysis. For example if we see 30 genes of x from a sample a containing total of 60 genes and 5 genes of x in sample b which contain a total of 10 genes, we might think x is more expressed in a than b while they both are expressed 50%. To account for this difference we will do count per million normalization which will divide each gene expression with its sequence depth and multiply it with 10^6.
- We then calculate the mean of each expressions and remove the samples which doesn’t have enough expression.
- We then perform Kolmogorov-Smirnov (KS) test. The KS test is non-paremetric, meaning that it doesn’t make any assumptions about the distributions being compared. KS might not be a very good statistical model to capture the real expression differences but its simplicity made it a good choice for this toy project.
First we use the ks_2samp to get the ks stat and the p value of the control and our subject. Which will test whther there is a difference within the distribution eventhough it doesn’t tell us whether there is a diffference withing the means which we techiqically looking for.
So we need to calculate the (fold change) between the mean expression level in each condition:
The inside term will give us the mean difference of the IPF in comparsion to the control. and the outer log term makes that difference symmetrical to zero.
So if IPF is x2 of the control we get 1 and if its 1/2 of the control we get -1.
epsilon (often 1, 0.1, or 0.01) and adding it to both means before doing the calculation to avoid getting zero in both numenator and denomintor to avoid getting zero and dividing by zero.
and we apply Bonferroni correction, multiplying each p-value by the number of tests we did. This will give us the BC corrected p-values and the log fold change which represent the biological significance(statistical significance with p-value and biological revelance with log fold change)
- Now we can use our
p_values_bonfandlog2_FCsarrays to select a list of differentially expressed genes (DEGs) between the two conditions. The threshold choice is somewhat arbitrary here. I’m going to usep_values_bonf <= 0.05for statistical significance, andnp.abs(log2_FCs) >= 2to select genes with a very large effect size (the IPF mean must be greater than 4x or less than 1/4 the control mean).
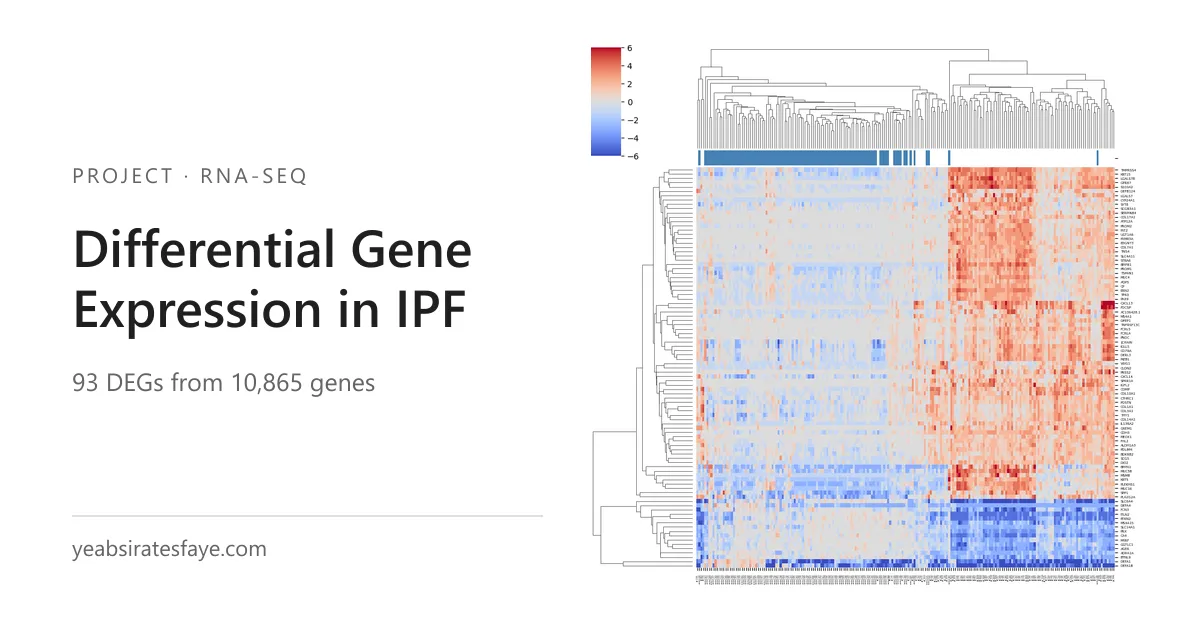
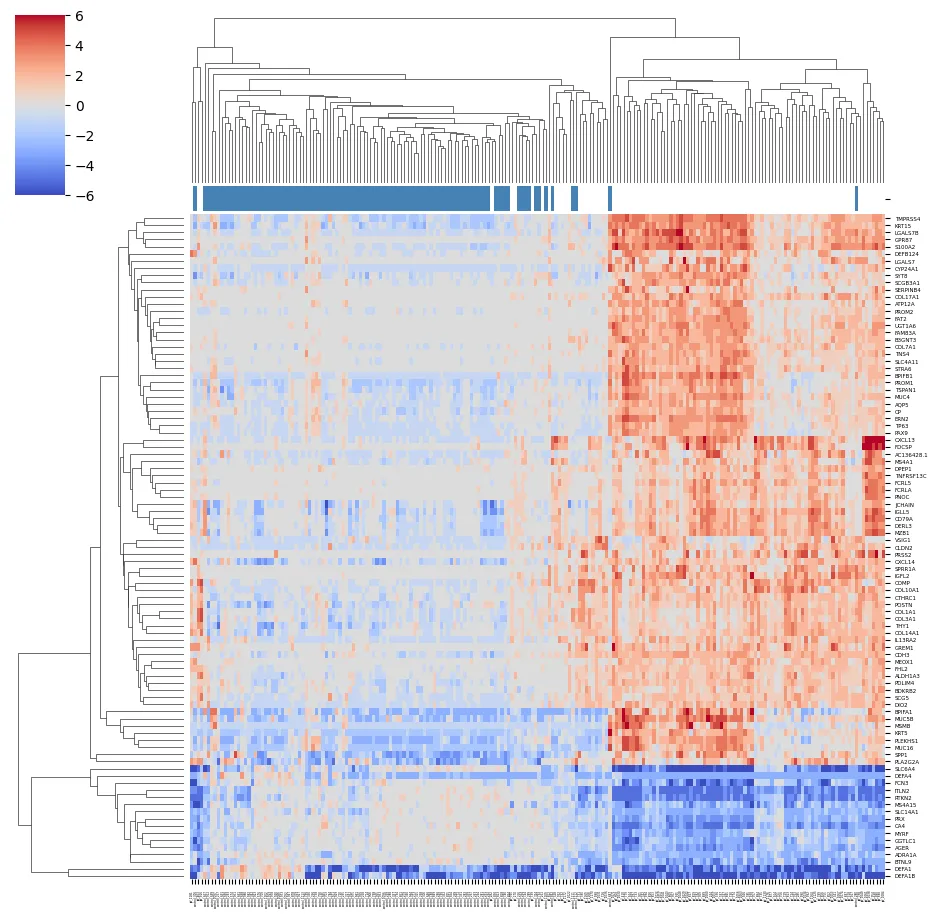
From our analysis of total of 10865 genes selected for analysis(filtered ipf vs control), we found that 93 of them are Differentially expressed genes(DEG). From these 93, 77 of them are upregulated DEGs, meaning have significantly higher expression in IPF than in control and 16 of them are downregulated DEGs meaning have significantly lower expression in IPF than in control. We can plot cluster map based on control mean of each 93 genes and see
- White / pale = ~0 → expression is close to the average control level.
- Red = positive log2 fold-change → that gene is expressed more highly than control .
- Blue = negative log2 fold-change → that gene is expressed less than control .
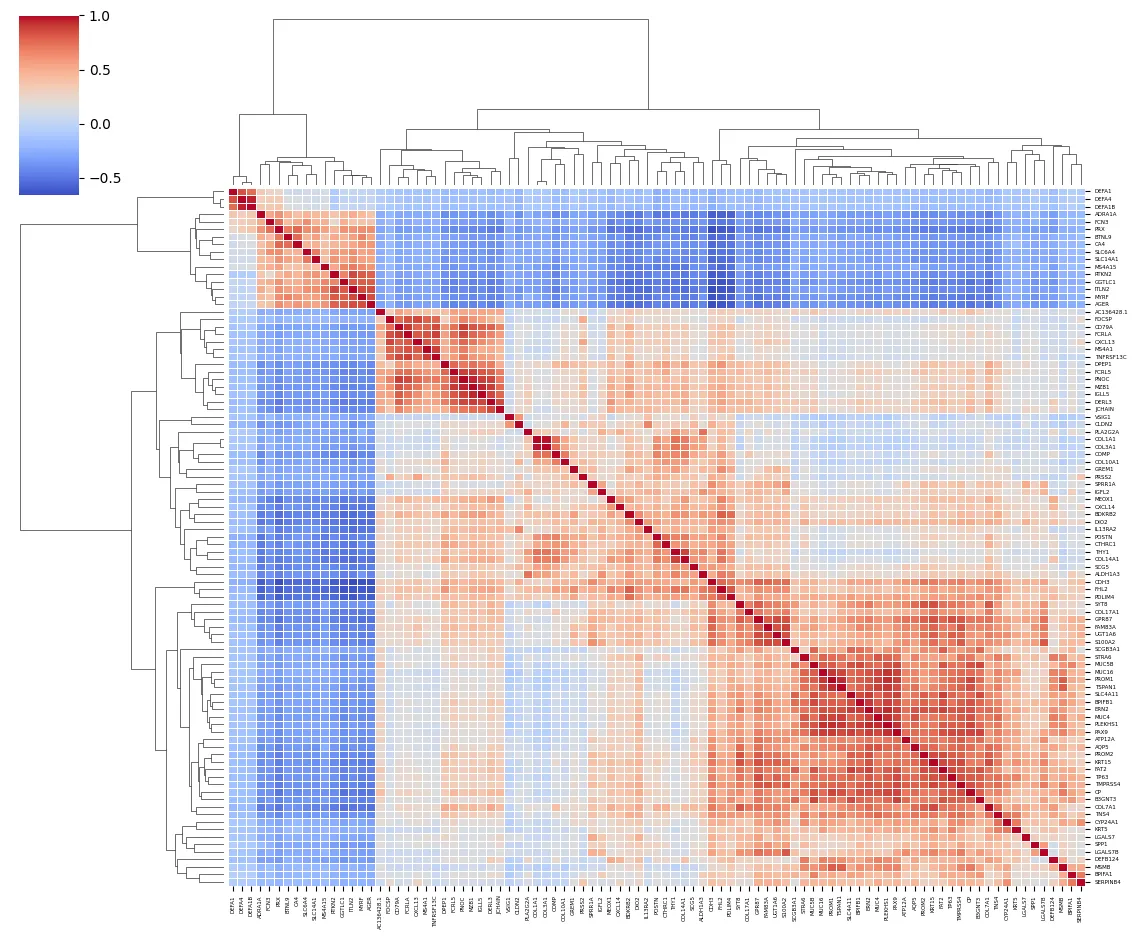
We can also plot the correlation between genes and how their expression affect each other.
- Dark red ≈ +1 → Very strong positive correlation. When one gene is high, the other tends to be high; when one is low, the other tends to be low.
- White/grey ≈ 0 → little or no consistent linear relationship.
- Blue < 0 → negative correlation. When one gene is high, the other tends to be low.
The red diagonal is always 1.0, because every gene is perfectly correlated with itself.
We can also try to analyze the expression of POSTN is the gene for periostin, a secreted extracellular-matrix protein which is strongly associated with fibroblast activation, tissue remodeling, wound repair, and fibrosis. Increased POSTN expression is a useful sign of an activated fibrotic program. We can plot both bar and scatter expression plots.
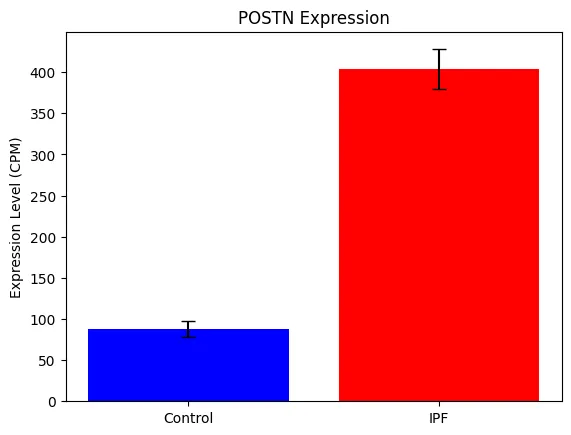
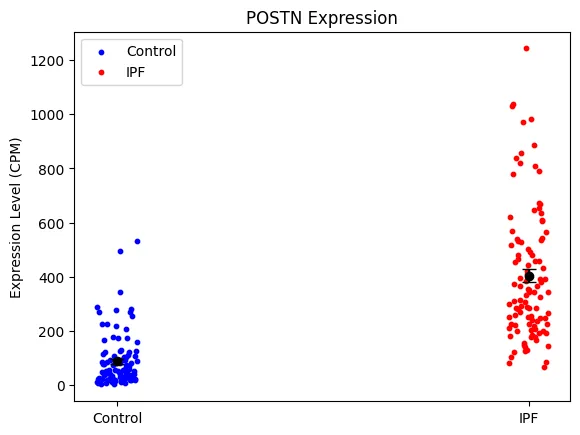
As we expected we see more expression in samples taken from IPF than the control ones.